Note
Go to the end to download the full example code.
Creating a Spherical Grid#
While add_latitudinal_lines() and add_grid() method allows users to
create a full spherical grid as a single PolyData object.
The add_grid() method takes three tuples as arguments, which
define the grid in the radial, theta, and phi directions. Each tuple should contain four
values, viz.:
the starting value of the grid (inclusive)
the stopping value of the grid (inclusive)
the number of points in the grid (including the start and stop values)
the resolution of the gridlines (the number of points used to draw each gridline)
Note
As these spherical grids are converted into the native cartesian coordinate system of VTK for visualization, the resolution will determine the “smoothness” of the curved gridlines in the theta and phi directions. A higher resolution will result in smoother gridlines. The radial direction, however, does not possess this same property and therefore it is seldom necessary to use a resolution higher than 2 for the radial grid.
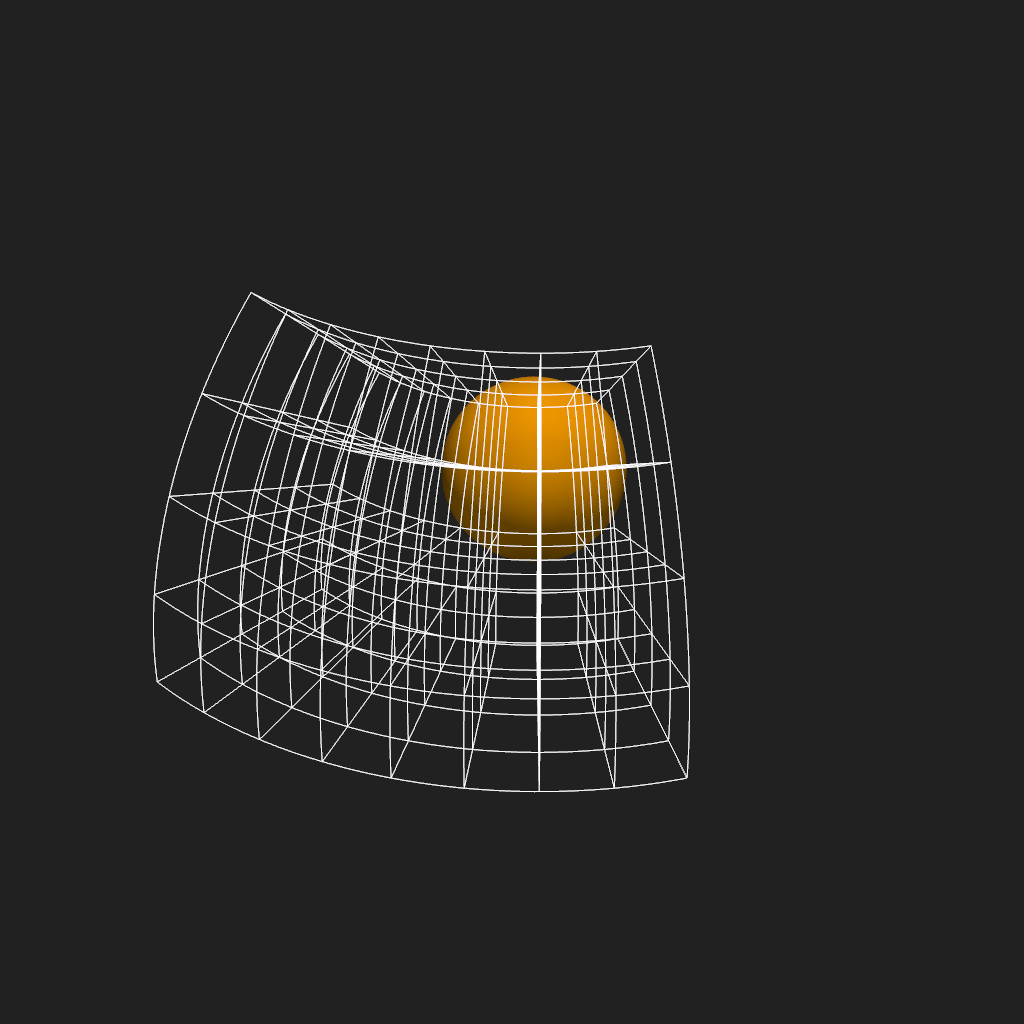
rgrid_args = (3, 5, 5, 2)
tgrid_args = (pi/4, pi/2, 5, 32)
pgrid_args = (0, pi/3, 9, 32)

plotter = Plot3d()
plotter.add_sun()
plotter.add_grid(rgrid_args, tgrid_args, pgrid_args)
plotter.show()
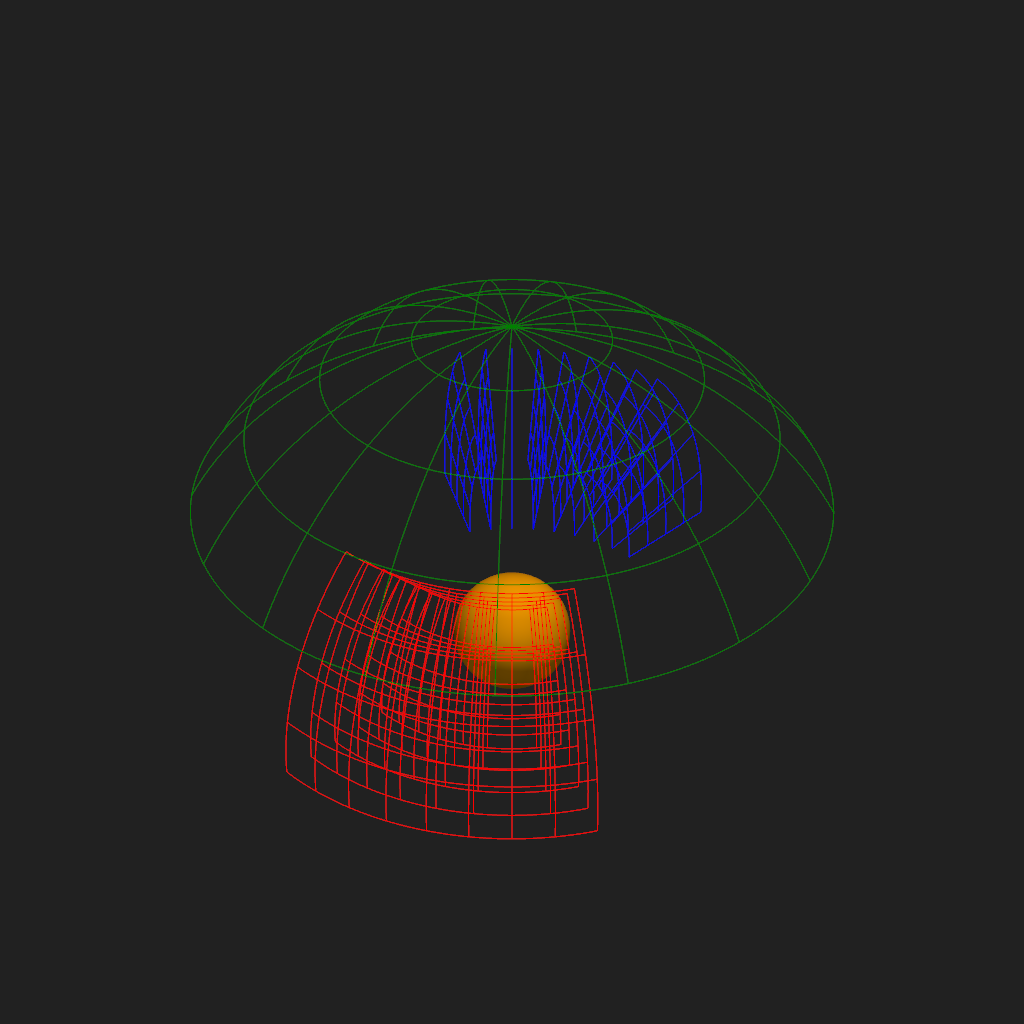
By manipulating the arguments of these tuples, you can create a variety of grid types e.g. by specifying a single point in resolution in a given dimension, you can create a grid that only has lines in the remaining two directions; or, alternatively, by specifying the same value in the start and stop values, you can create a 2-D grid in a plane defined by the remaining two dimensions.
Since the **kwargs of the add_grid() method are passed
to the underlying add_mesh() method, you can also manipulate the color,
opacity, and other visual properties of the grid.
plotter = Plot3d()
plotter.add_sun()
plotter.add_grid(
    (3, 5, 5, 1),
    tgrid_args,
    pgrid_args, color='red')
plotter.add_grid(
    rgrid_args,
    tgrid_args,
    (pi, 4*pi/3, 9, 1), color='blue')
plotter.add_grid(
    (6, 6, 1, 1),
    (0, pi/3, 5, 32),
    (0, 2*pi, 18, 180), color='green')
plotter.show()
Total running time of the script: (0 minutes 2.975 seconds)