Examples#
The examples below are organized into galleries that mirror the functional
areas of the Plot3d API. Each gallery is
self-contained; to run the complete suite of examples, it is recommended to
install the optional dependencies, viz.:
pip install "psi-pyvisual[tracing,data]"
See also
- Overview
Conceptual introduction to the coordinate conventions and class hierarchy used throughout pyvisual.
- Installation
Installation instructions for pyvisual, along with a list of its optional dependencies.
- API Reference
Full API reference for all public classes and functions (including a variety of additional examples).
Data Access#
Examples that use Predictive Science Inc’s MAS model data call
psi_data.fetch_mas_data(), which downloads a small
set of data files from the PSI asset server on first run and
caches them under ~/.cache/psi/ (or $PSI_DATA_CACHE if set).
Examples that use only NumPy arrays run without any network access.
MHDweb#
These data-fetching routines (psi_data, distributed as
psi-data-utils) are designed to provide ready access to a sample MAS
run for testing and demonstration purposes.
For access to the full catalogue of Predictive Science Inc’s publically available MAS (Magnetodydrodynamic Algorithm outside a Sphere) model solutions – over 2100 runs spanning nearly 5 decades – please visit MHDweb.
This web-based data-visualization suite includes a wide variety of highly customizable data products which can be downloaded directly through the web interface (e.g. Spacecraft Mapping, White Light Imagers, EUV & X-Ray Emissions) or programmatically accessed through the MHDweb API.
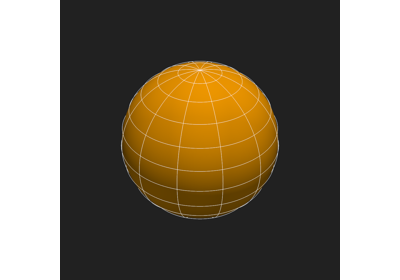
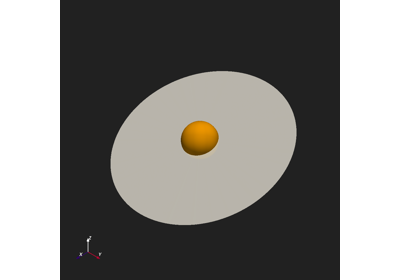
Getting Started#
Introductory examples covering the basics of
Plot3d: instantiating the plotter, adding
geometry to the scene, and controlling actor visibility.
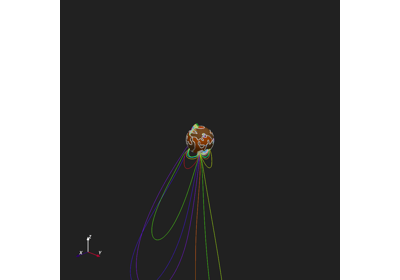
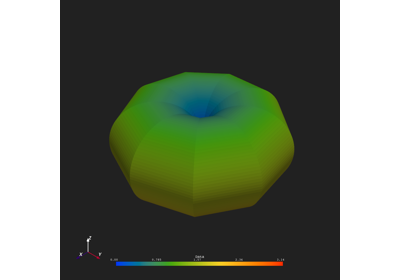
Stack Mesh Mixin#
Examples demonstrating StackMeshMixin — the
mixin that renders geometry from stacked N-D coordinate arrays, where every
element of r, t, and p shares the same array shape and corresponds
to a single spatial location.
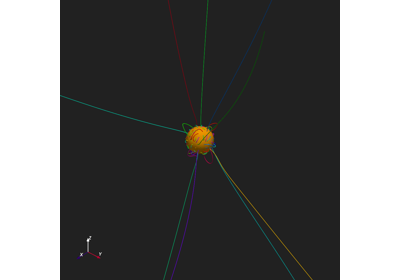
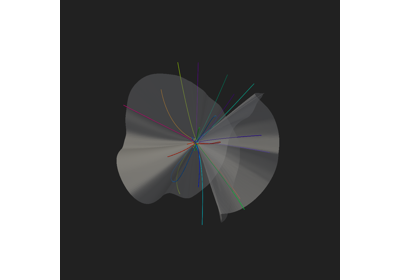
Grid Mesh Mixin#
Examples demonstrating GridMeshMixin — the
mixin that renders structured-grid data from independent 1-D axis arrays or
pre-broadcast 3-D arrays, including fieldline tracing with
mapflpy.
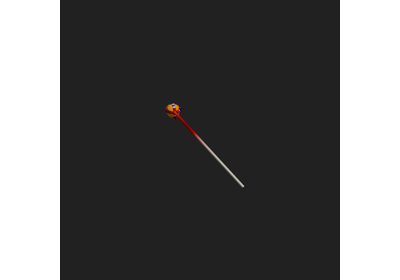
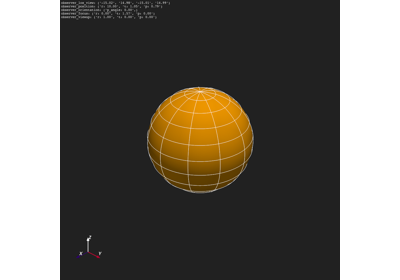
Observer Mixin#
Examples demonstrating ObserverMixin — the
mixin that positions and orients the camera in spherical coordinates, controls
the field of view, and provides a live camera-state text overlay.
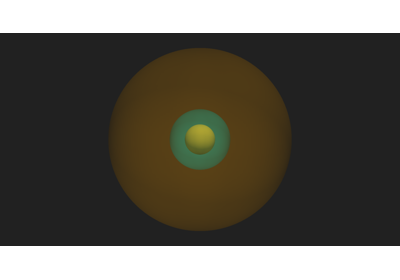
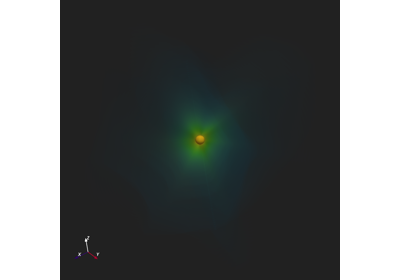
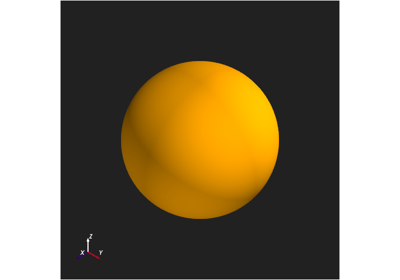
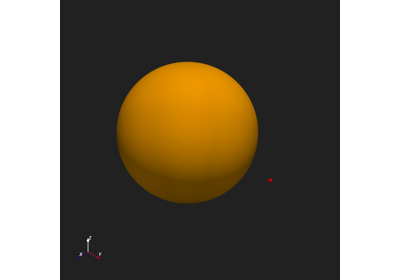
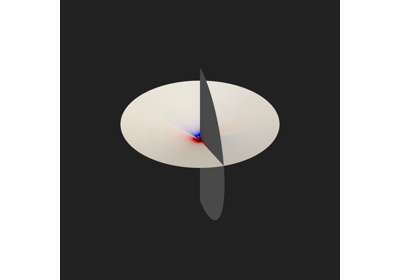
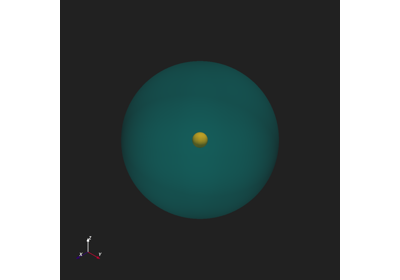
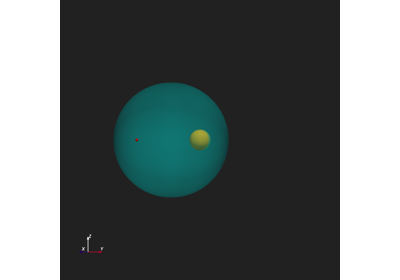
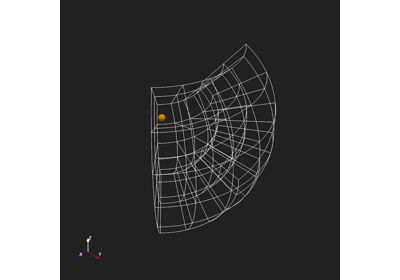
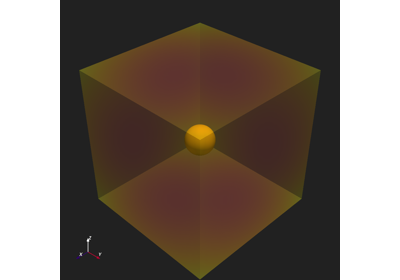
Geometry Mixin#
Examples demonstrating GeometryMixin — the
mixin that adds solar geometry primitives to the scene: the Sun sphere,
concentric shells, planar discs, the Thomson sphere, and structured spline
grid lines.
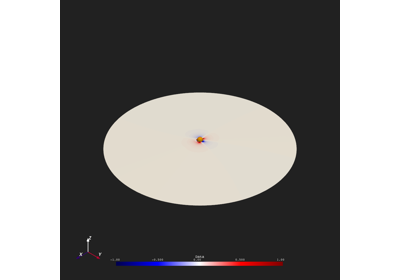
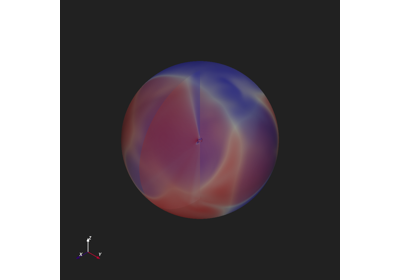
SphericalMesh#
Examples demonstrating the SphericalMesh class
— the primary data container for structured \((r, \theta, \phi)\) grids.
Topics include construction from NumPy arrays, arithmetic and NumPy ufunc
support, and the filter methods for radial scaling and coordinate remapping.


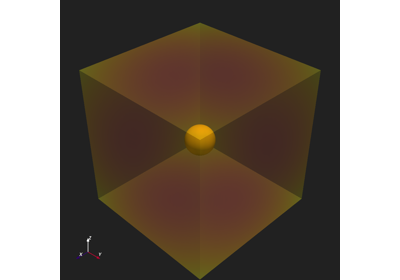
CartesianMesh#
Examples demonstrating the CartesianMesh class
— the Cartesian-frame counterpart to SphericalMesh.
Topics include construction from NumPy arrays, coordinate-frame conversion from
a SphericalMesh, and direct rendering via
Plot3d.
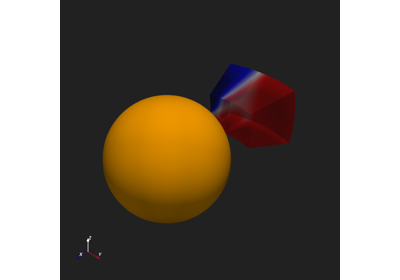
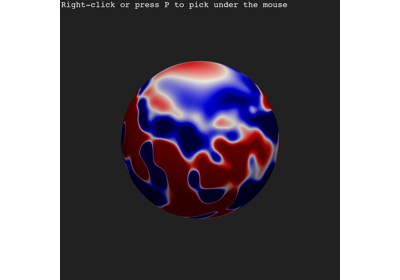
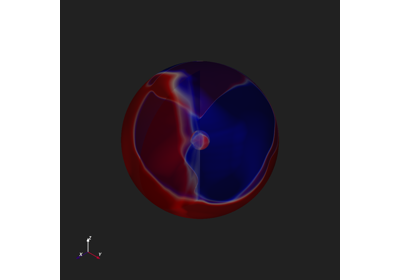
Advanced Examples#
More complex examples combining multiple elements of the
Plot3d API: multi-domain fieldline tracing,
interactive point picking with callbacks, and combined slice/contour/fieldline
scenes.