Note
Go to the end to download the full example code.
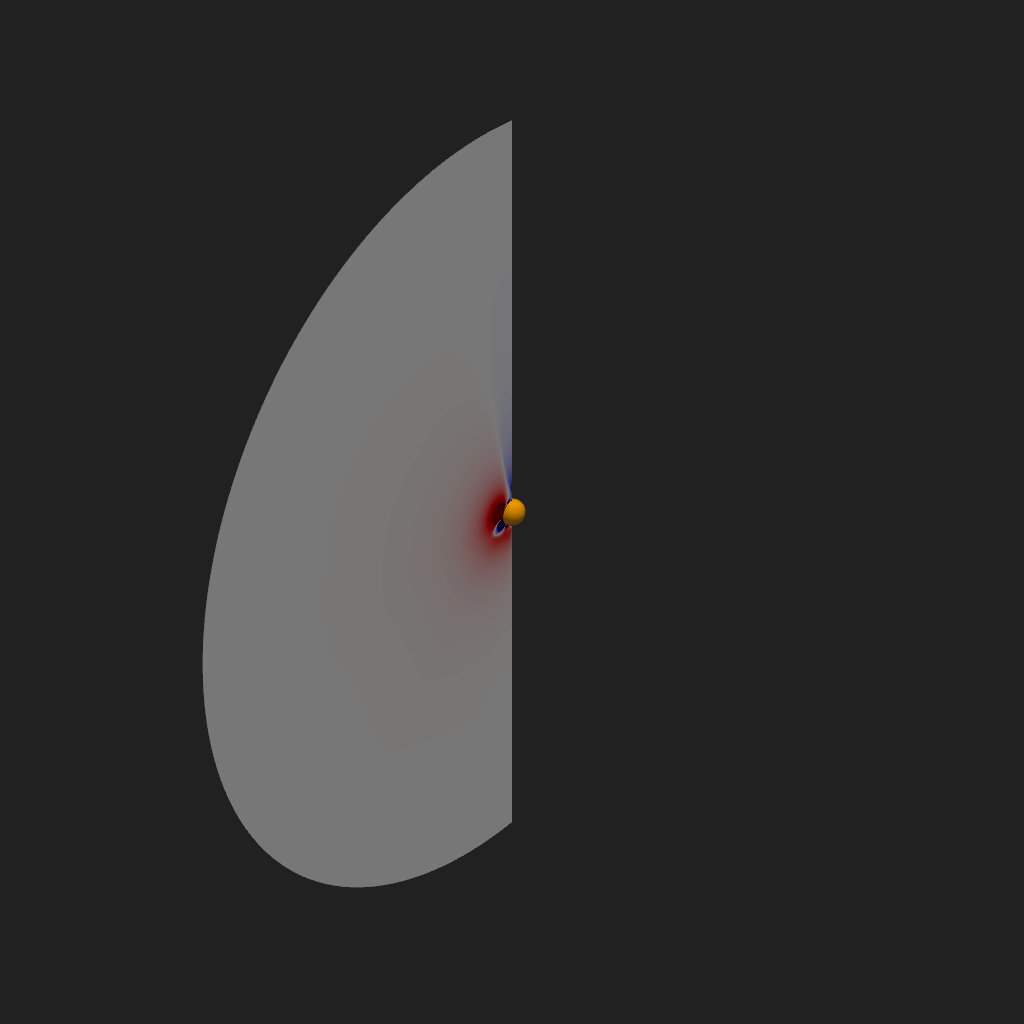
TODO add description
from pyvisual import Plot3d
from pyvisual.utils.data import fetch_datasets
from psi_io import read_hdf_data

data = fetch_datasets("cor", "br")
br, rscale, tscale, pscale = read_hdf_data(data.cor_br)

plotter = Plot3d(off_screen=True)
plotter.add_sun()

plotter.open_gif("cor_br_phi_slice.gif")
for i in range(0, pscale.size, 5):
    plotter.add_2d_slice(rscale, tscale, pscale[i], br[i,...],
                         name="Phi Slice",
                         clim=(-1e-1, 1e-1),
                         cmap="seismic",
                         show_scalar_bar=False)
    plotter.camera.focal_point = 0,0,0
    plotter.write_frame()
plotter.close()
Total running time of the script: (0 minutes 4.186 seconds)