Note
Go to the end to download the full example code.
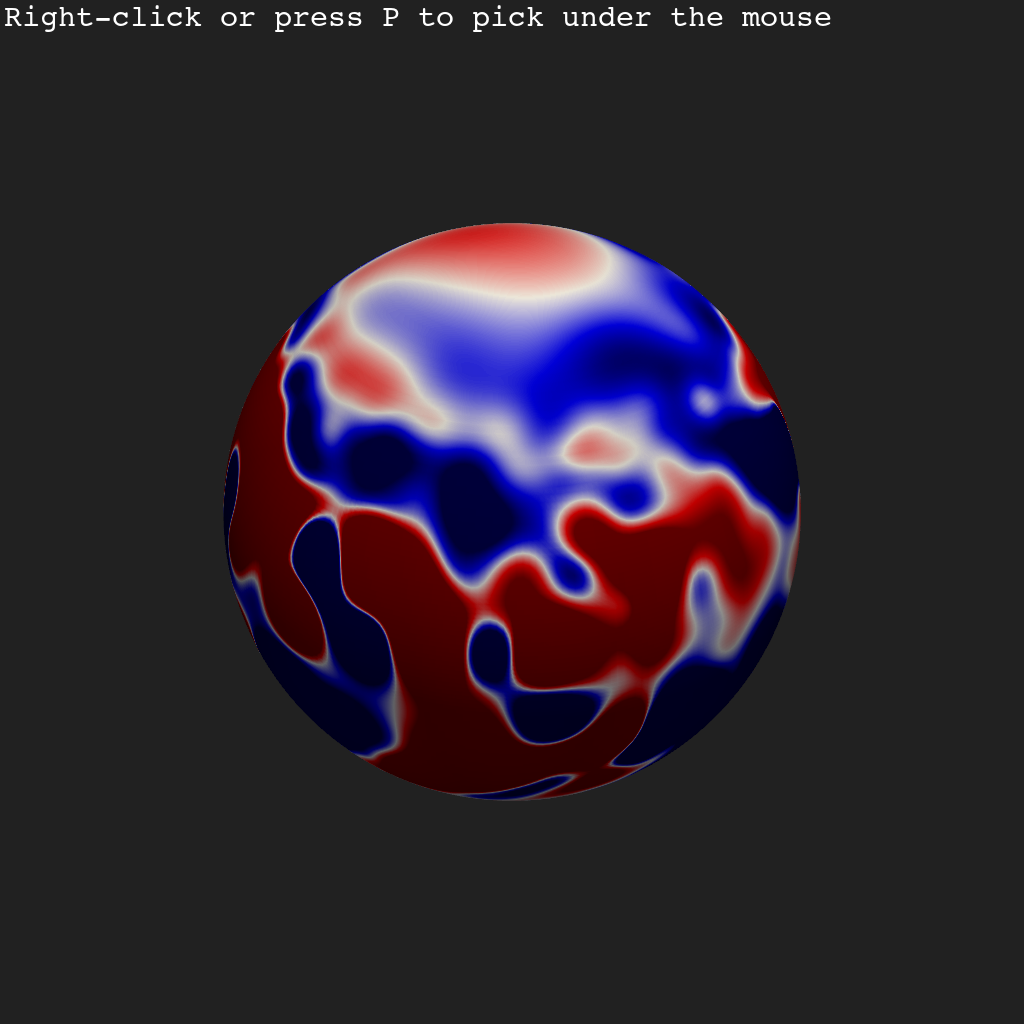
TODO add description
import pyvista as pv
from pyvisual import Plot3d
from pyvisual.utils.geometry import cartesian_to_spherical
from pyvisual.utils.data import fetch_datasets
from psi_io import np_interpolate_slice_from_hdf
from mapflpy.tracer import Tracer
import numpy as np
import astropy.units as u

from pyvisual.utils.geometry import cartesian_pointmesh

data = fetch_datasets("cor", ["br", "bt", "bp"])
br, *scales = np_interpolate_slice_from_hdf(data.cor_br, 1, None, None)
br_t, br_p = scales

plotter = Plot3d()
tracer = Tracer(*data)
pv.set_new_attribute(plotter, "buffer", 0)
BUFFER_SIZE = 5

def _plotter_callback(pt):
    plotter.buffer += 1
    r, t, p = cartesian_to_spherical(*pt)
    lps, weights = cartesian_pointmesh(1, t, p, angular_radius=1, dimensionality=(1, 0, 0), pts_per_direction=5)
    fieldlines, *_ = tracer.trace_fwd(launch_points=lps.reshape((3, -1)))
    fls = fieldlines.reshape((-1,) + lps.shape)
    plotter.add_points(*lps, name="Launch Points",)
    plotter.add_fieldlines(*np.swapaxes(fls, 0, 1),
                                                      weights,
                                                      cmap='hsv',
                                                      name=f'Fieldlines{plotter.buffer % BUFFER_SIZE}',
                                                      show_scalar_bar=False,
                           line_width=20,
                                                      opacity='linear_r')

plotter.enable_point_picking(_plotter_callback)
plotter.add_2d_slice(1, br_t, br_p, br,
                     clim=(-1, 1),
                     cmap="seismic",
                     show_scalar_bar=False,
                     pickable=True)

plotter.show()
Total running time of the script: (0 minutes 0.480 seconds)