Note
Go to the end to download the full example code.
Setting the Magnetic Field#
Explicitly set the magnetic field files using the TracerMP class.
This example demonstrates how to use explicitly set the TracerMP
magnetic field data i.e. br, bt,
and bp attributes.
import matplotlib.pyplot as plt

from mapflpy.tracer import TracerMP
from mapflpy.utils import plot_traces
from psi_data import fetch_mas_data
Load in the magnetic field files
The fetch_mas_data() function returns a named tuple of file paths
corresponding to the radial, theta, and phi components of the magnetic field data for the
requested domain (with fields like cor_br, cor_bt, cor_bp for the coronal domain
and hel_br, hel_bt, hel_bp for the heliospheric domain).
magnetic_field_files = fetch_mas_data(domains="cor", variables="br,bt,bp")
hel_magnetic_field_files = fetch_mas_data(domains="hel", variables="br,bt,bp")
The TracerMP class is, for demonstration purposes, instantiated
without arguments to illustrate how to set the magnetic field files post-initialization.
Note
As with Tracer, the magnetic field data can be set using the
br, bt,
and bp attributes, or by passing the file paths to
load_fields()
Warning
When setting the magnetic field data with TracerMP, only a
filepath can be supplied i.e. not a NumPy array, as with Tracer.
This is due to the inter-process communication mechanism used by
TracerMP and the prohibitive cost of passing magnetic field data
over the pipe.
Here we pass along the n and r parameters to the trace_fwd() and
trace_bwd() methods to specify the number of field lines to trace
and the starting radius respectively.
with TracerMP(context=CONTEXT) as tracer:
with TracerMP(context=CONTEXT) as tracer_hel:
tracer.br = magnetic_field_files.cor_br
tracer.bt = magnetic_field_files.cor_bt
tracer.bp = magnetic_field_files.cor_bp
tracer_hel.load_fields(*hel_magnetic_field_files)
tracer_hel['domain_r_min_'] = 30
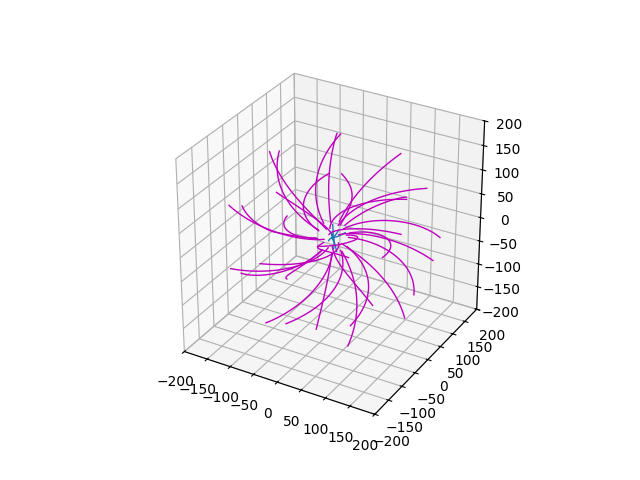
traces = tracer.trace_fwd(n=128, r=1)
traces_hel = tracer_hel.trace_bwd(n=32, r=200)
Plot traces using the plot_traces() utility function and adjust
the field of view to be 200 Solar Radii in each direction.
Total running time of the script: (0 minutes 1.836 seconds)